Today I want to show you the new statistics window in Diving Log 6.0. It is using a new chart drawing engine, which has support for mouse, keyboard and touch input methods as well as animations. The “Copy” and “Save” toolbar buttons will now save also the general statistics as text file in addition to the charts as image file. Here you can see some screenshots:
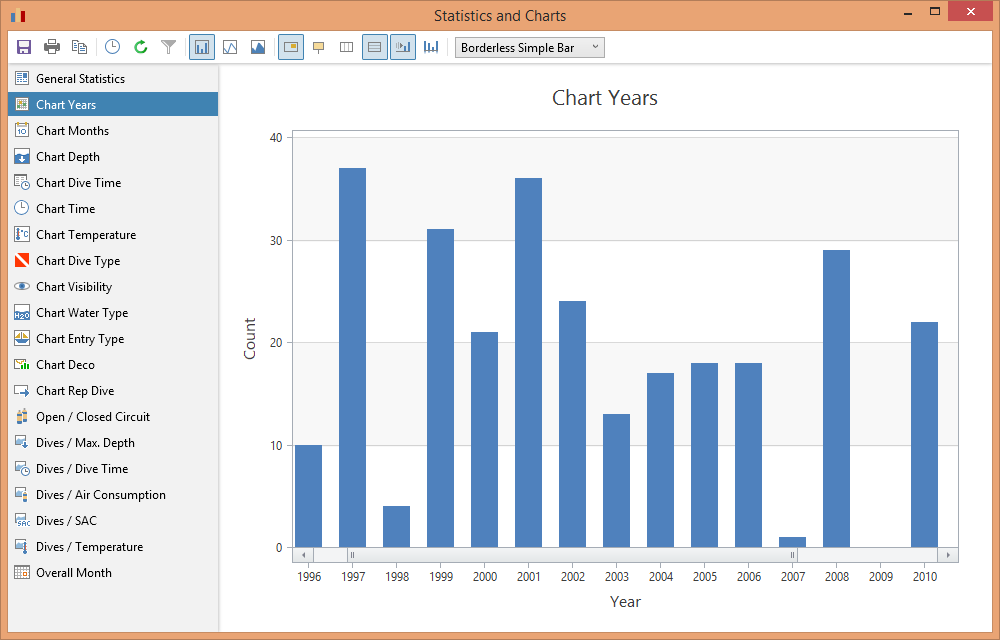
Chart Years
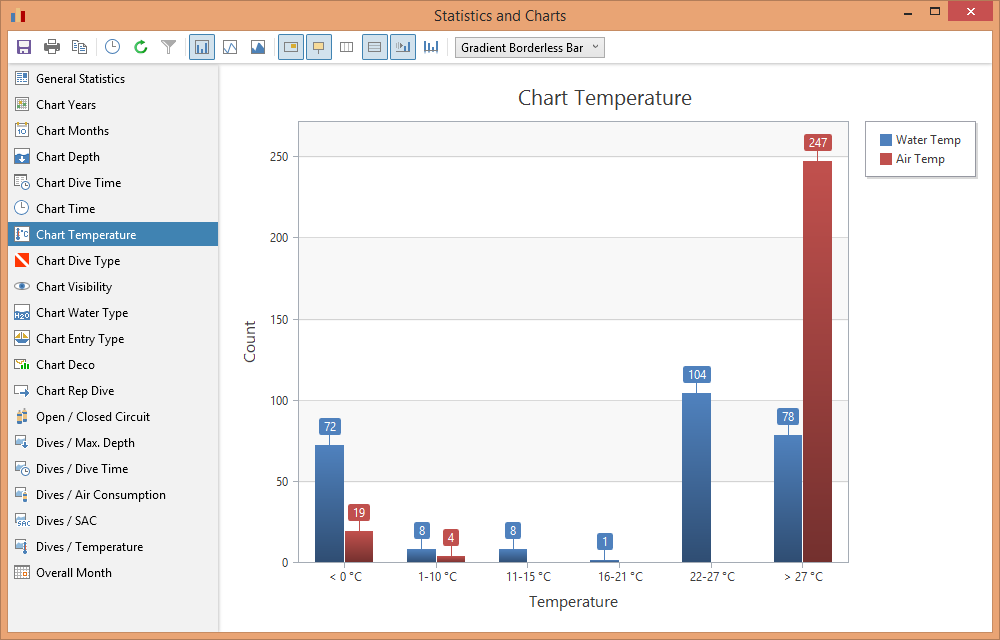
Chart Temperature

Pie and donut charts
Scroll through the chart with the mouse, keyboard or touch

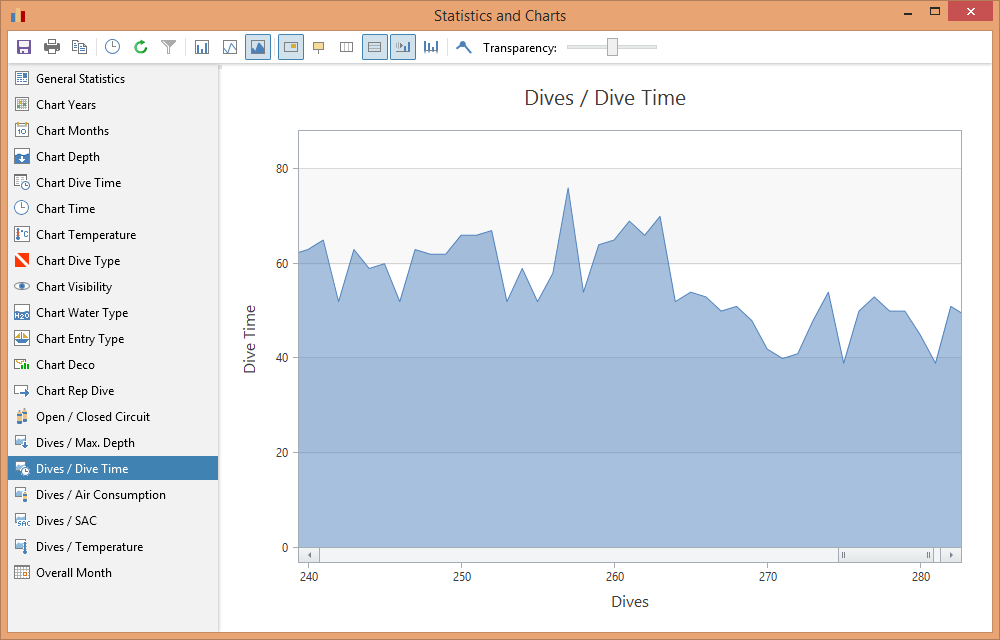
Line Chart
I’ve also added a new feature to the maps window, to show optionally all dive site labels. That way you can create local dive site overview maps:

Option to show all dive site labels
Tags: Diving Log 6.0, Maps, Statistics